Observing kgateway with OpenTelemetry
kgateway is a Kubernetes Gateway API implementation based on Envoy. Like other gateways and ingress controllers, it sits directly on the request path at the edge of the cluster, terminating connections, applying routing rules, and forwarding traffic to backend services. Because every external request flows through it, the gateway is also one of the most valuable places to observe what users actually experience.
In this post, we’ll look at kgateway’s OpenTelemetry support from two angles. First, we’ll examine how traces, logs, and metrics are exposed in practice using a small, self-contained test environment. Second, we’ll evaluate that behavior using a draft maturity model that breaks “OpenTelemetry support” into a set of concrete dimensions. The goal isn’t to produce a score, but to make trade-offs and friction points visible. The full draft of the model lives in a public GitHub issue, where feedback and discussion are very welcome.
How we’ll evaluate OpenTelemetry support
OpenTelemetry support isn’t binary. Most projects land somewhere in between: traces might be native, metrics might still rely on Prometheus scraping, logs might correlate cleanly in some paths but not others. To make those differences easier to talk about, we’ll use a draft maturity model that evaluates OpenTelemetry support across several independent dimensions.
At a high level, the model looks at OpenTelemetry support across the following dimensions, each evaluated independently on a scale from Level 0 (Instrumented) to Level 3 (OpenTelemetry-Optimized):
- Integration Surface – how users connect the project to their observability pipelines
- Semantic Conventions – how consistently telemetry meaning aligns with OpenTelemetry conventions
- Resource Attributes & Configuration – how identity and configuration behave across environments
- Trace Modeling & Context Propagation – how traces are structured and how context flows
- Multi-Signal Observability – how traces, metrics, and logs work together in practice
- Audience & Signal Quality – who the telemetry is designed for and how usable it is by default
- Stability & Change Management – how telemetry evolves once users depend on it
This model is an early draft, and this post should be read as an application of the model rather than a definitive judgment of the quality of the support of OpenTelemetry in kgateway. Gateways are a particularly useful place to test this model, because they exercise all three current stable OpenTelemetry signals (logs, metrics, traces) and sit at a natural boundary in terms of cloud native architectures: the edge of Kubernetes clusters.
Evaluation environment
The observations in this post are based on a small test environment built around kgateway. It includes kgateway running as a Gateway API data plane, an in-cluster OpenTelemetry Collector, and a simple Node.js backend used to generate realistic request traffic.
Telemetry is collected using OpenTelemetry-native mechanisms and exported to an open source observability stack: traces to Jaeger, metrics to Prometheus, and logs to OpenSearch. Rather than walking through the setup step by step, the purpose of this environment is to validate how kgateway behaves once telemetry is enabled and traffic is flowing.
This keeps the focus on signal behavior and integration characteristics, rather than on deployment mechanics.
Tracing at the gateway
Tracing is where kgateway is at its strongest. Tracing is configured
declaratively using the Gateway API’s policy attachment model via
ListenerPolicy.
No application changes or sidecars are required.
Under the hood, kgateway relies on Envoy’s native OpenTelemetry support and exports spans directly over OTLP/gRPC. If a request arrives with W3C trace context headers, kgateway continues that trace. If it doesn’t, the gateway creates a new root span at the edge. In both cases, the gateway becomes a first-class participant in the distributed trace.
An important detail is upstream span creation. kgateway can optionally emit a span representing the hop from the gateway to the backend service. This makes routing latency and gateway-introduced delays visible without overwhelming the trace with internal implementation detail.

In Jaeger, this results in traces that feel complete. The entry point is clear, the handoff to the backend service is explicit, and the gateway no longer appears as an opaque box at the front of the trace.
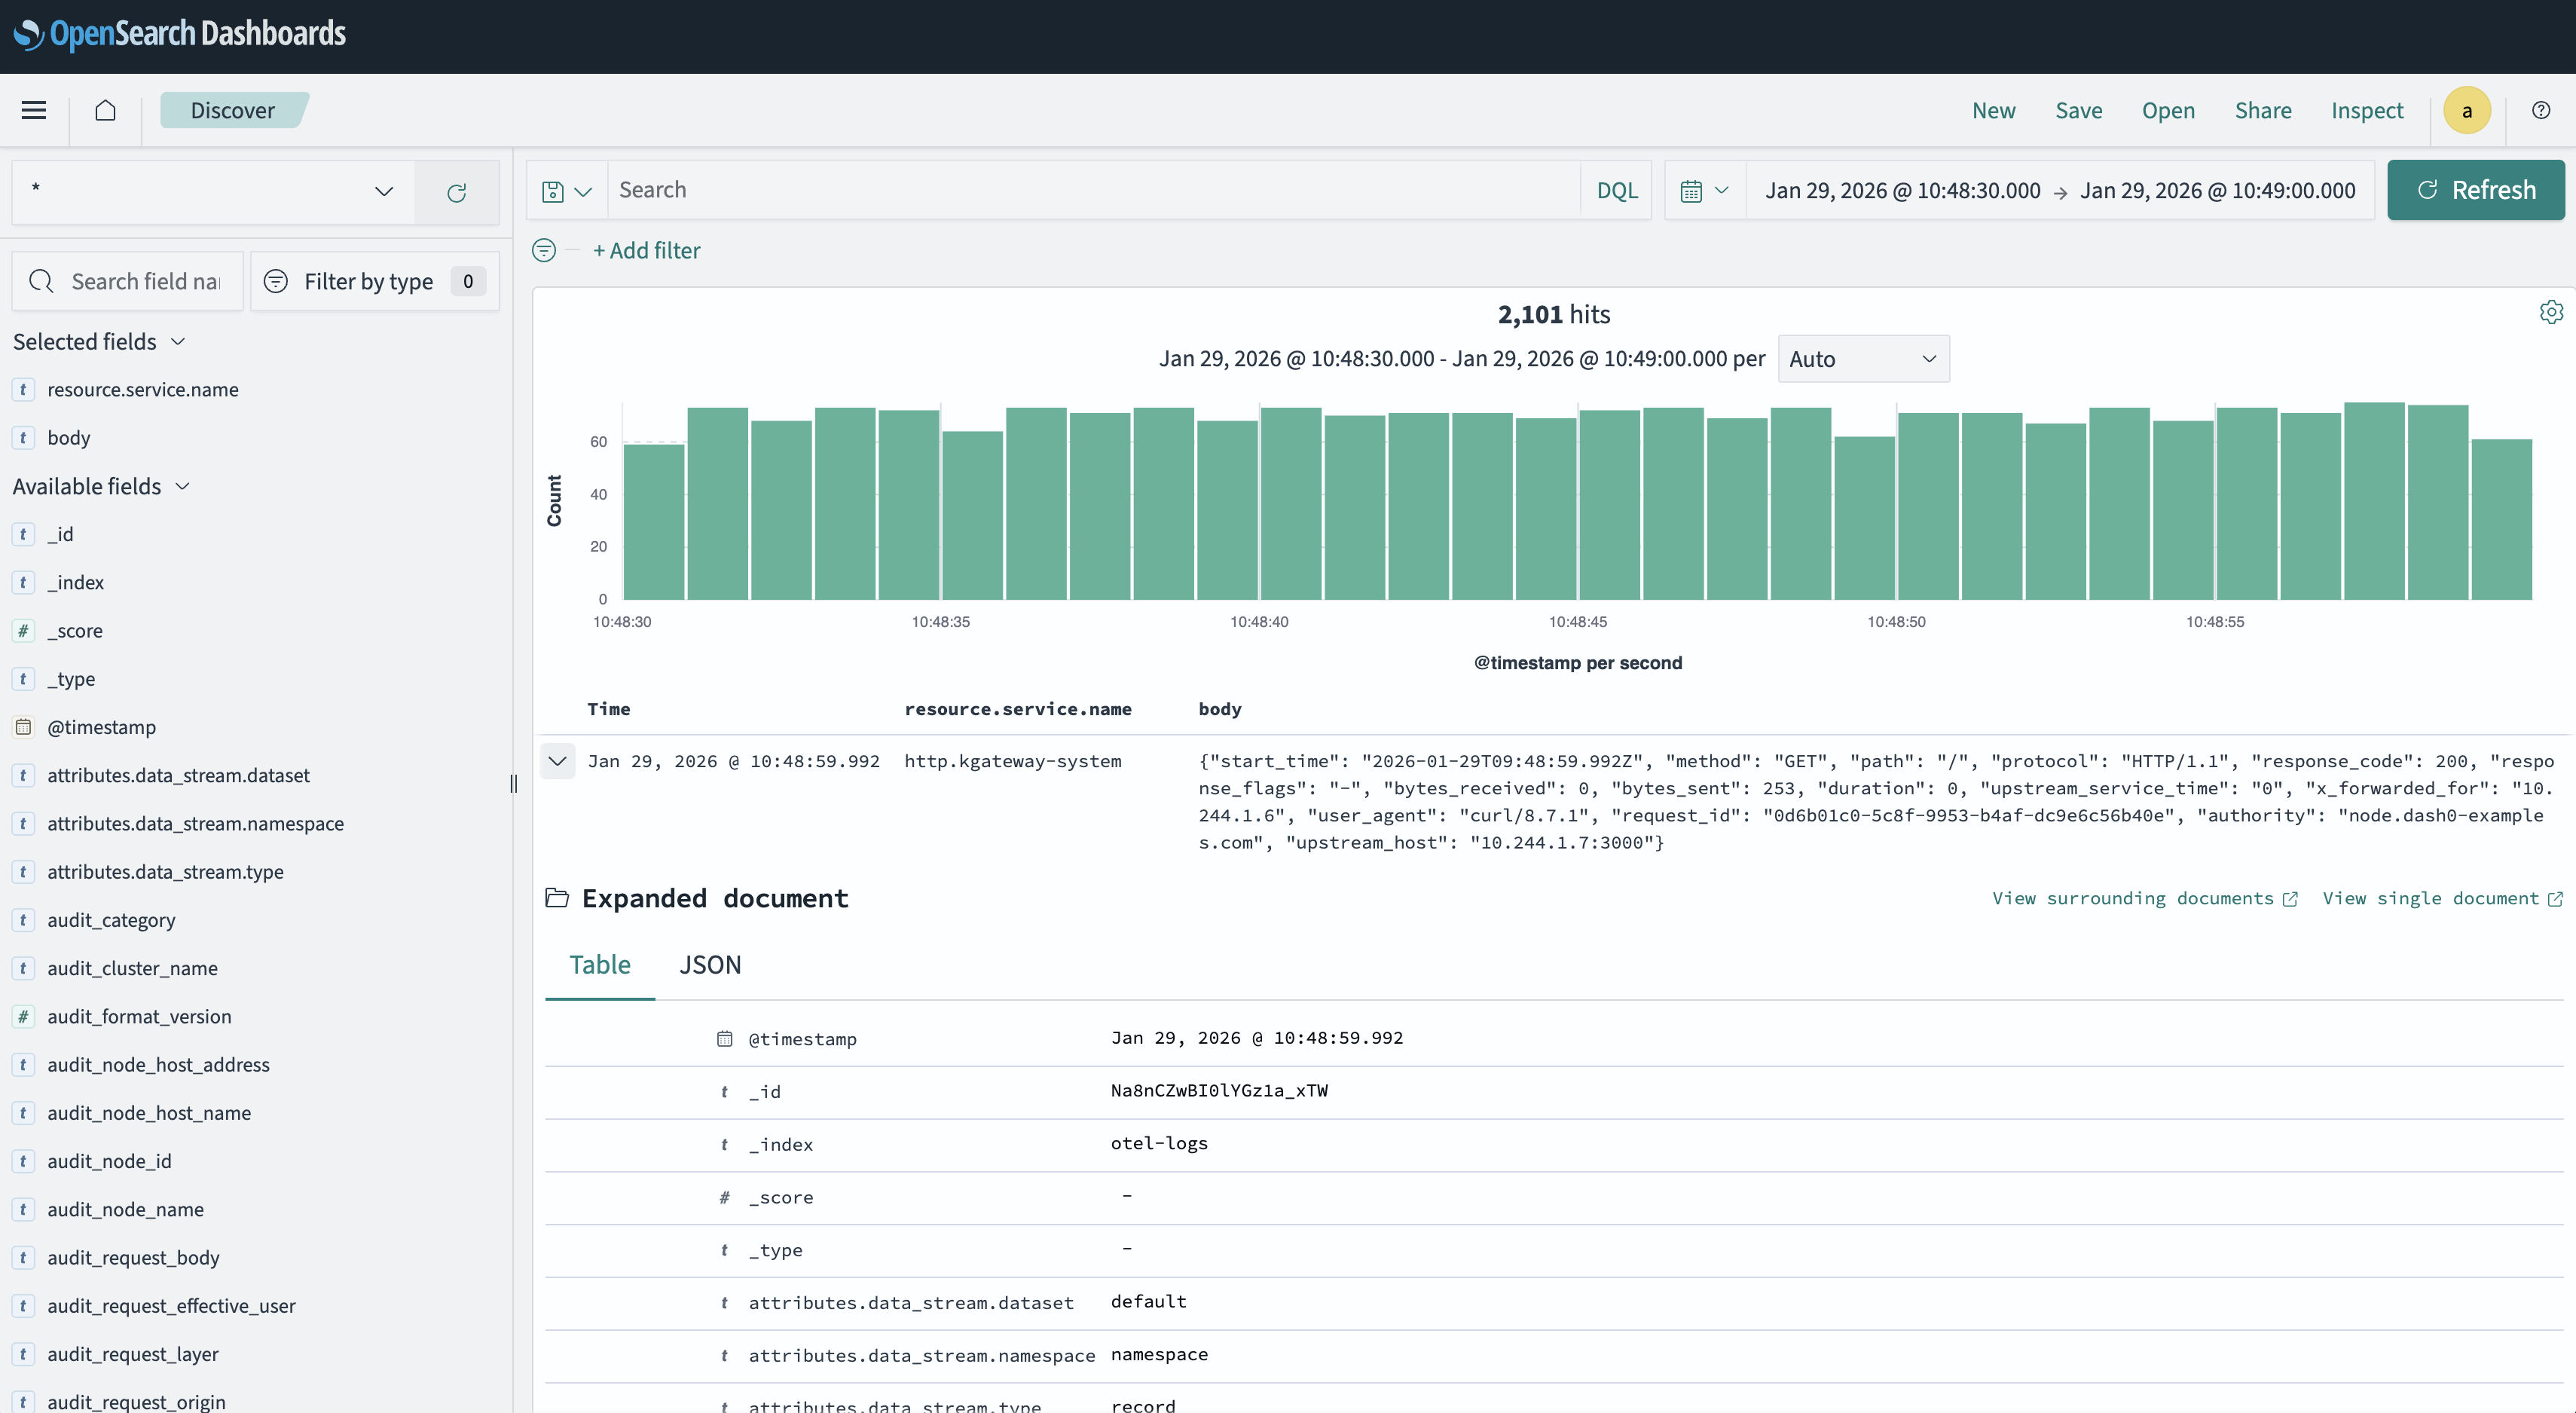
Access logs with native OpenTelemetry correlation
Access logs are another strong area. kgateway can export structured access logs
directly over OTLP/gRPC using Envoy’s OpenTelemetry access log sink. Logs are
emitted as OpenTelemetry LogRecords rather than plain text.
The key difference compared to many ingress setups is correlation with tracing
data through trace context. Trace ID and span ID are attached automatically at
the LogRecord level. There is no need to inject traceparent into the log body
and no need to write parsing or transformation rules to extract it later, or
other commonplace workarounds to backfill the trace-context correlation from
logs to spans.
The log body itself is configurable using Envoy’s standard formatting operators, allowing request metadata, response codes, timing information, and upstream details to be included directly in the log record.

This makes logs feel like a first-class OpenTelemetry signal rather than something retrofitted onto a tracing pipeline.
Metrics: powerful, but still Prometheus-native
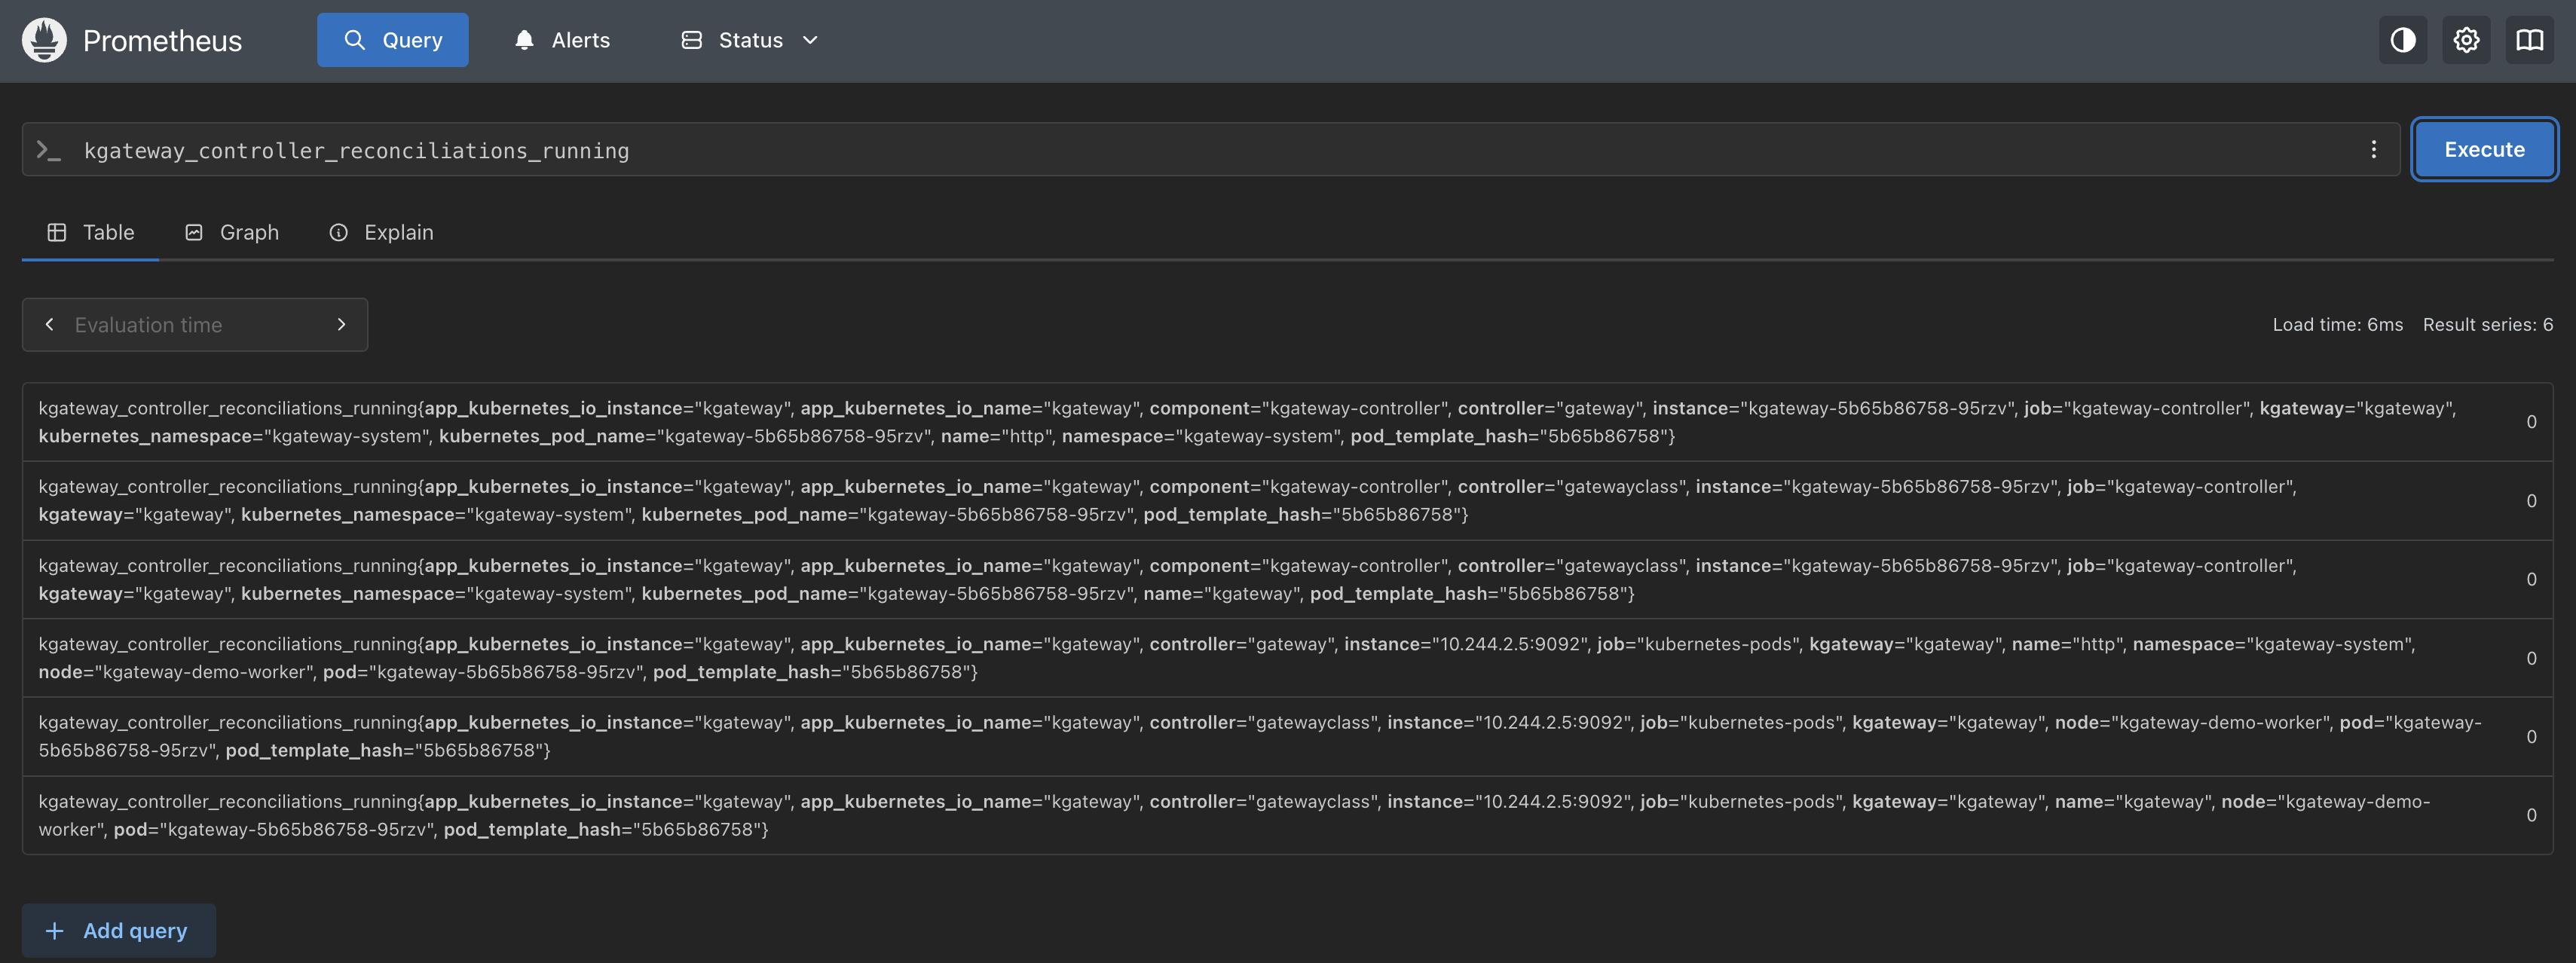
Metrics are where kgateway follows a more traditional path. Both the controller and the Envoy data plane expose metrics exclusively in Prometheus format. These include the full set of Envoy statistics - request counts, response codes, connection pools, upstream health - alongside controller-level reconciliation and lifecycle metrics.
There is no OTLP metrics export option today. To bring metrics into the same observability pipeline, the OpenTelemetry Collector scrapes the Prometheus endpoints using the Prometheus receiver. From there, metrics can be enriched with Kubernetes resource attributes and queried using PromQL.

This approach works well in practice and mirrors how many Envoy-based projects are observed today. However, it does mean that metrics follow a different collection model than traces and logs, which are pushed over OTLP. This further reinforces that it does not follow OpenTelemetry HTTP or RPC semantic conventions, and neither has the built-in notion of metric unit.
Summary view: kgateway OpenTelemetry maturity
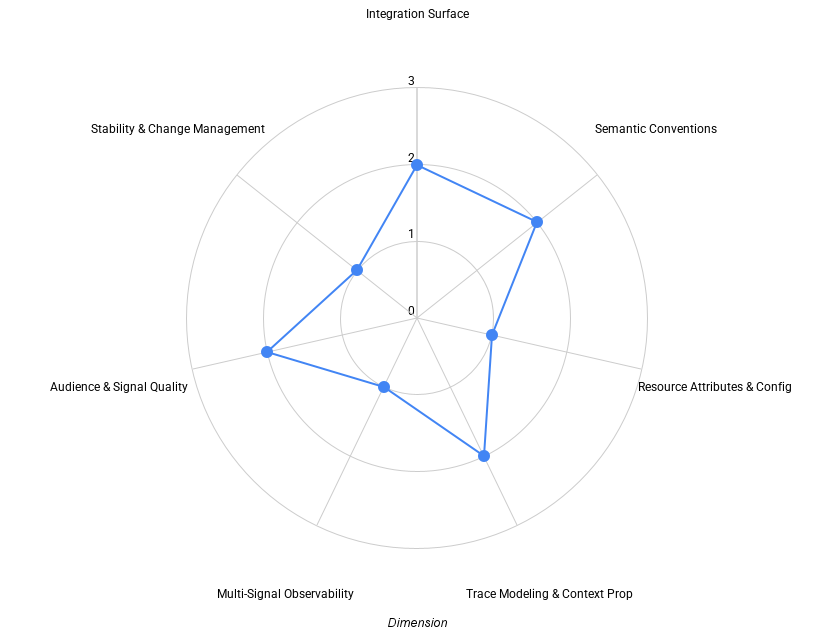
Before diving into each dimension, the radar chart below provides a high-level overview of how kgateway’s OpenTelemetry support shapes up across the model.
 Radar chart showing kgateway’s OpenTelemetry maturity across evaluation
dimensions
Each dimension is scored independently on a 0–3 scale, where higher values indicate deeper, more intentional OpenTelemetry integration.
The purpose of this chart isn’t to produce a single score. It’s to highlight where the experience is already strong and where users are likely to feel friction. In kgateway’s case, the shape reflects a project that is OpenTelemetry-native for traces and logs, with metrics still anchored in the Prometheus ecosystem.
Dimension-by-dimension analysis
Integration Surface
kgateway exposes tracing and logging via OTLP/gRPC using a Gateway API–native policy resource. This provides a clean integration surface: configuration is declarative, works across environments, and fits naturally into Collector-based pipelines.
Metrics, however, are exposed only via Prometheus endpoints and do not follow HTTP or RPC semantic conventions. As a result, users interact with two integration paths: OTLP for traces and logs, and Prometheus scraping for metrics.
OpenTelemetry is the primary interface for two signals, but not all three.
Semantic Conventions
Because kgateway builds on Envoy’s OpenTelemetry support, traces and logs follow familiar shapes and are easy to interpret using standard OpenTelemetry knowledge. In terms of spans, HTTP semantics are consistent, and correlation works without project-specific interpretation.
One caveat is that some HTTP attributes still follow older OpenTelemetry
semantic conventions. For example, spans use http.status_code rather than the
current http.response.status_code, and legacy HTTP attribute names such as
http.method and http.url are present. This is due to the upstream Envoy
proxy dependency, which has not yet adopted the latest OpenTelemetry semantic
conventions — a gap shared by all Envoy-based proxies. You can track the
progress on this in the
Envoy issue #30821.
Telemetry is generally consistent and interoperable, with room for more intentional refinement.
Resource Attributes & Configuration
kgateway exposes a stable service.name and behaves predictably across
namespaces and environments. However, resource identity is intentionally minimal
at the source and relies heavily on downstream enrichment rather than explicit
modeling by the gateway itself.
Only a limited subset of standard service-level resource attributes is emitted
at the source. While service.name is present, attributes such as
service.namespace, service.version, and service.instance.id are not set.
In addition, service naming is not fully consistent across signals, with
different values observed between traces and logs. This limits the ability to
group related gateway components, distinguish replicas, or compare behavior
across releases without additional pipeline-level normalization.
Kubernetes resource attributes are largely absent at the source. Critical
identifiers such as k8s.pod.uid, k8s.pod.name, container, workload, node,
and cluster attributes are not emitted directly by kgateway. As a result,
standard Collector-side processors (such as the Kubernetes attributes processor)
must rely on indirect or connection-based association to derive workload and
infrastructure context, making enrichment dependent on pipeline topology and
deployment model.
Runtime customization of resource identity is limited. In particular,
OTEL_RESOURCE_ATTRIBUTES is not consistently honored by the gateway runtime,
and supported resource detectors are not documented as part of the gateway’s
observability contract. This limits users’ ability to inject environment,
ownership, or deployment-specific context at runtime without modifying gateway
configuration or relying entirely on downstream enrichment.
As a result, identity and configuration are stable in practice, but depend on downstream enrichment and non-standard attributes rather than an explicit, source-level resource model. This provides a workable baseline for many deployments, but falls short of the explicit, interoperable, and runtime-configurable resource modeling expected at higher maturity levels.
Trace Modeling & Context Propagation
Context propagation follows W3C Trace Context standards, allowing kgateway to participate cleanly in distributed traces regardless of upstream implementation details. When incoming requests do not carry an existing trace context, the gateway reliably creates a new root span at the edge, ensuring that traces always have a well-defined starting point.
Beyond basic propagation, kgateway also supports optional upstream span creation, emitting a client span that represents the hop from the gateway to the backend service. This results in traces that clearly distinguish between ingress handling and upstream request execution, making gateway-induced latency and routing behavior visible without exposing unnecessary internal detail.
The trace model is intentionally focused on common synchronous request flows. More advanced propagation formats or custom trace semantics are not enabled by default, but Envoy’s extensibility model leaves room for such behavior to be introduced through extensions or additional processing where required.
Overall, the resulting trace structure is coherent and predictable for typical gateway workloads. While it does not attempt to capture more complex asynchronous or domain-specific behaviors out of the box, it reflects deliberate trace modeling choices rather than reliance on defaults alone.
Multi-Signal Observability
kgateway exposes three signals traces, logs, and metrics - but does so using a mixed delivery model. Traces and logs are emitted natively over OTLP, while metrics are exposed in Prometheus format and collected through scraping.
Once ingested, these signals can be unified through the OpenTelemetry Collector and correlated downstream. However, the difference in collection models introduces a split in configuration and operational concerns. Traces and logs follow a push-based, OpenTelemetry-native path, while metrics rely on Prometheus-style pull semantics, including endpoint discovery and scrape configuration.
In practice, this means that correlation across signals is achieved at the pipeline level rather than being fully expressed by the gateway itself. This approach works well and aligns with common Envoy and Prometheus-based observability patterns today, but it falls short of a fully OTLP-first, multi-signal experience.
Audience & Signal Quality
From a user perspective, kgateway’s telemetry is immediately usable. OTLP-native tracing and automatically correlated access logs significantly reduce the effort required to understand request flows through the gateway. Users can move between traces and logs without manual trace ID injection, custom parsing, or additional correlation logic.
Telemetry defaults are sensible and work without extensive customization. Common debugging workflows - such as identifying slow requests, understanding routing decisions, or validating upstream responses - are supported out of the box once data is ingested into an OpenTelemetry-compatible backend.
The signals are primarily optimized for infrastructure and platform engineers rather than application developers. Telemetry focuses on gateway behavior, routing, and latency rather than business-level or application-specific semantics, which is appropriate for this layer but also defines the scope of its usefulness. This makes the telemetry particularly well suited for platform and infrastructure teams operating shared gateways.
Stability & Change Management
In observed behavior, kgateway’s telemetry is stable and predictable. Span structure, attribute presence, and signal behavior appear consistent across executions, which is important for users building dashboards, alerts, and operational workflows that depend on this data.
However, stability at scale also depends on explicit commitment. There is limited documentation describing telemetry as a long-lived contract, and changes to emitted attributes, naming, or structure are not clearly governed or communicated from an observability perspective. As more users depend on this telemetry for production workflows, this lack of explicit guarantees can increase the cost of upgrades or changes.
Today, stability is achieved primarily through implementation consistency rather than through formal change management, versioning, or published expectations around telemetry evolution.
Where kgateway lands
Taken together, kgateway’s OpenTelemetry support aligns most closely with Level 2 overall. OpenTelemetry is clearly a primary integration path for tracing and logging, configuration is Gateway API–native, and correlation across signals works once telemetry is ingested into an OpenTelemetry pipeline.
At the same time, several aspects limit higher maturity. Metrics remain Prometheus-first, resource identity is largely derived through downstream enrichment rather than explicit source-level modeling, and runtime configurability of telemetry is limited. These trade-offs do not prevent effective observability, but they do increase reliance on pipeline configuration and external conventions.
This shape is common among Envoy-based infrastructure projects today. It reflects a pragmatic balance between stability and adoption, while also highlighting a clear path forward as OTLP metrics support matures and resource modeling becomes a more explicit part of gateway observability design.
A brief look ahead: agentgateway
It’s worth briefly mentioning agentgateway in the context of the analysis above. While kgateway builds on Envoy and reflects the current state of OpenTelemetry adoption in established gateway architectures, agentgateway represents a newer class of Gateway API implementations designed specifically for AI and LLM traffic.
agentgateway was built with OpenTelemetry as a first-order design constraint. Traces and logs are emitted natively over OTLP, and metrics focus on domain-specific signals such as token usage, model selection, and provider behavior. As a result, observability concerns that appear as incremental improvements in kgateway are foundational design choices in agentgateway.
Placed alongside kgateway, this contrast highlights how starting with OpenTelemetry as the primary integration surface can shape observability characteristics from the outset, rather than retrofitting them onto an existing gateway model.
Closing thoughts
kgateway demonstrates how far OpenTelemetry support at the gateway layer has come. Native OTLP tracing and logging, reliable context propagation, and declarative configuration via the Gateway API make it straightforward to integrate kgateway into modern, open source observability stacks.
At the same time, the analysis also makes the remaining gaps more visible. Metrics today still follow a Prometheus-first model, which works well operationally but creates a split between push-based and pull-based telemetry. That split isn’t unique to kgateway, but it does shape how platform teams design and operate their pipelines.
The good news is that the kgateway maintainers are already working on closing the gaps in areas within their control and are collaborating with the upstream Envoy community to improve overall alignment with OpenTelemetry conventions. If you want to get involved or follow the progress, the kgateway project is a great place to start.
This is exactly why a dimensional maturity model is useful. Instead of collapsing “OpenTelemetry support” into a single label, it allows us to talk concretely about where a project is strong, where it’s evolving, and where trade-offs are still being made. We’ll continue to apply this model across the rest of the series, both to validate the model itself and to make differences between gateway implementations easier to reason about.
If you have feedback on the model, the dimensions, or the interpretation here, the linked GitHub issue is the place to join the discussion.